A pump performance curve is defined as a manufacturer's chart plotting head versus flow. While this is true, most curves include a wealth of additional information. This information may have to do with the subject of power consumption, efficiency, priming, solids capability, or pump parts information. After design and fabrication of a pump, a prototype is tested to determine the pump's capabilities from high pressure, low flow conditions to low pressure, high flow conditions. After testing and documenting the pump's capabilities at the extremes of pressure and flow, a pump performance curve is finalized.
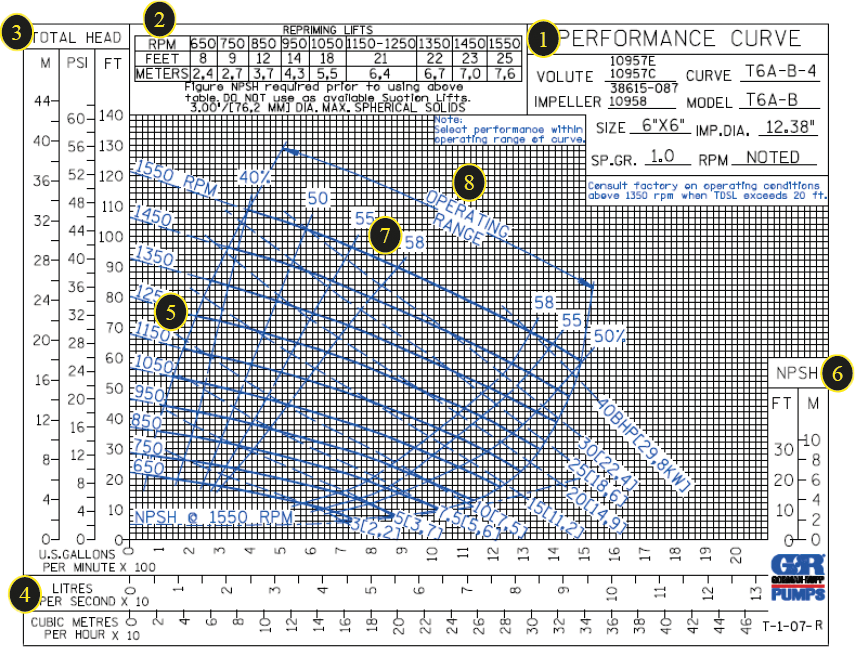
- The information provided in this area of the pump performance curve usually contains the performance curve number, pump volute casing part number, pump impeller part number and diameter, basic model number, the suction and discharge size openings, the specific gravity of the product that was used to test the pump, and the speed or speeds at which the pump is capable of operating.
- The information provided in this area may vary. It may provide general specification information or reprime data.
- The information provided in this area of the pump performance curve is total dynamic head. This value is found through the calculation of friction loss within the piping system added to the total static head. This value is also the combination of dynamic gauge readings from the suction and discharge. The values within this area are noted in Meters (M), Pounds Per Square Inch (PSI), and Feet (ft).
- The information provided in this area of the pump performance curve is flow. The values in the area are noted in U.S. Gallons Per Minute (GPM), Liters Per Second (l/s), and Cubic Meters Per Hour (m3/hr).
- The information provided in this area of the pump performance curve is the performance of the pump. It is shown in the form of H/Q or head/capacity lines. These head/capacity lines are noted by the speed required to achieve the head noted along the left side of the curve and capacity noted along the bottom.
- The information provided in this area is the Net Positive Suction Head Required (NPSHr) by the pump. Its value is found to the right of the NPSHr curve in the chart labeled "NPSH". The values in the chart are in feet and meters.
- The information provided in this area is the efficiency. This particular pump ranges from 40 to 58 percent efficient.
- This dimensional line denotes the full operating range or envelope of which the pump will perform satisfactorily.
A pump performance curve has basically three values, two of which like any mathematical equation have to be known to find the third. While troubleshooting a pump, two of the three that can be measured and known are speed (tachometer reading of the pump) and the total dynamic head (suction and discharge gauge readings). With these two known values, we can plot a condition point on the curve and find a flow rate from these two values. If a design condition point is supplied, it usually is done so in the form of a total dynamic head and a flow rate.
United States
Canada
Netherlands
Germany